2019-20 Update: Excel
Over the last year, Microsoft have released many updates, bringing a wide range of exciting new features to Excel. This course covers these updates and improvements to help you use Excel to its full potential.
This course is not currently available
This course will enable you to
- Utilise the cloud, communication and collaboration features
- Understand a range of performance improvements including, restoring files, accessibility and AI
- Learn the new functions and formula of Excel such as XLOOKUP, SWITCH, IFS and more
- Improve the way you present your data with updated visuals for example, 3D models and new funnel charts
About the course
Excel is undeniably one of accountants' most used tools. To make the most of what Excel has to offer, it is important to embrace the latest features and updates. But with so many improvements, big and small, happening throughout the year, it can be difficult to keep up with them.
This course covers the updates that Microsoft have released over the last year. These include communication and collaboration tools to performance improvement, and even new visuals. This course will help you to use Excel to its full potential.
Look inside

Contents
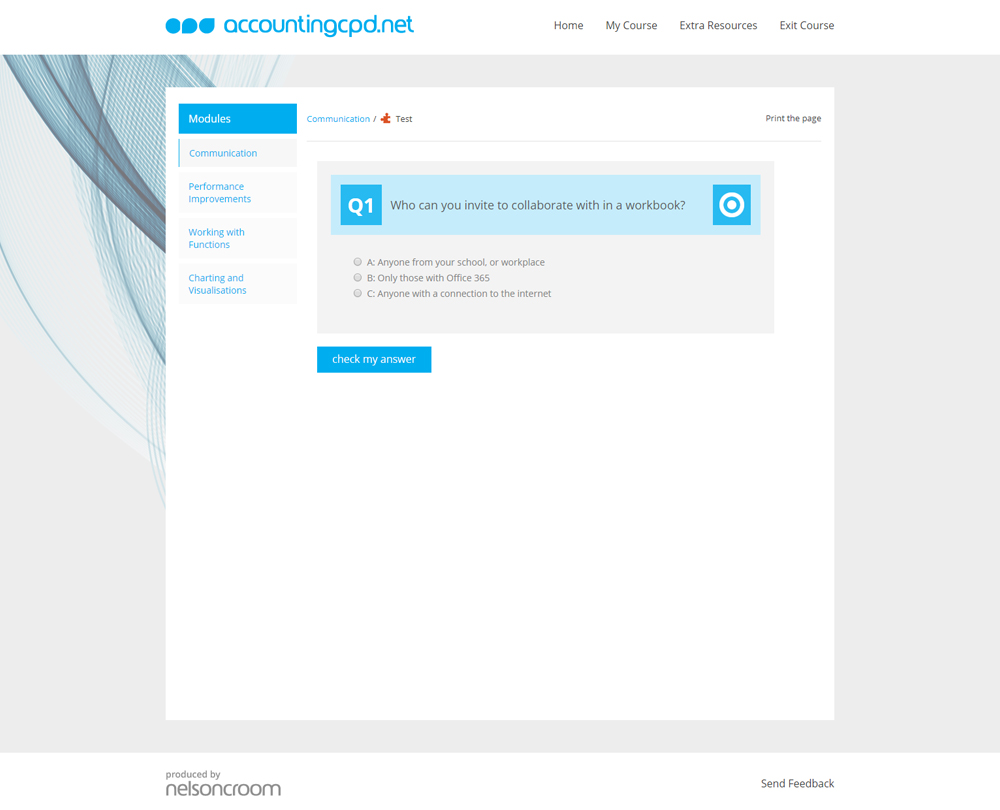
- Communication
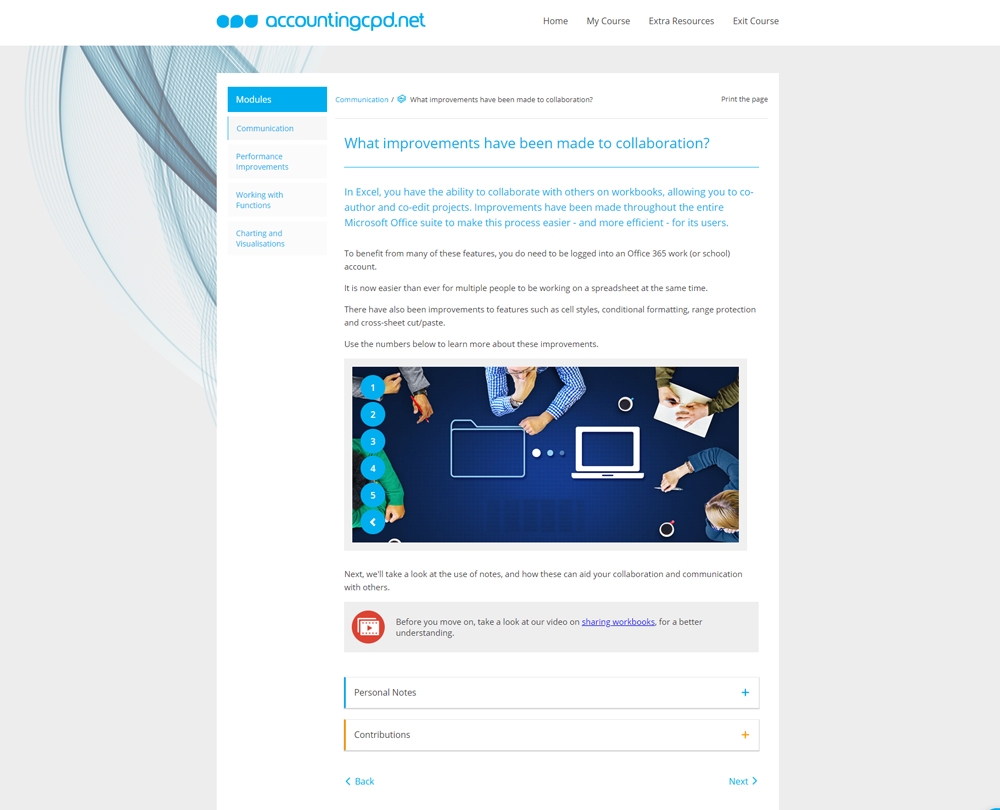
- What improvements have been made to collaboration?
- What are notes?
- What are comments and mentions?
- How do you translate workbooks into different languages?
- How do I use natural language search?
- Performance Improvements
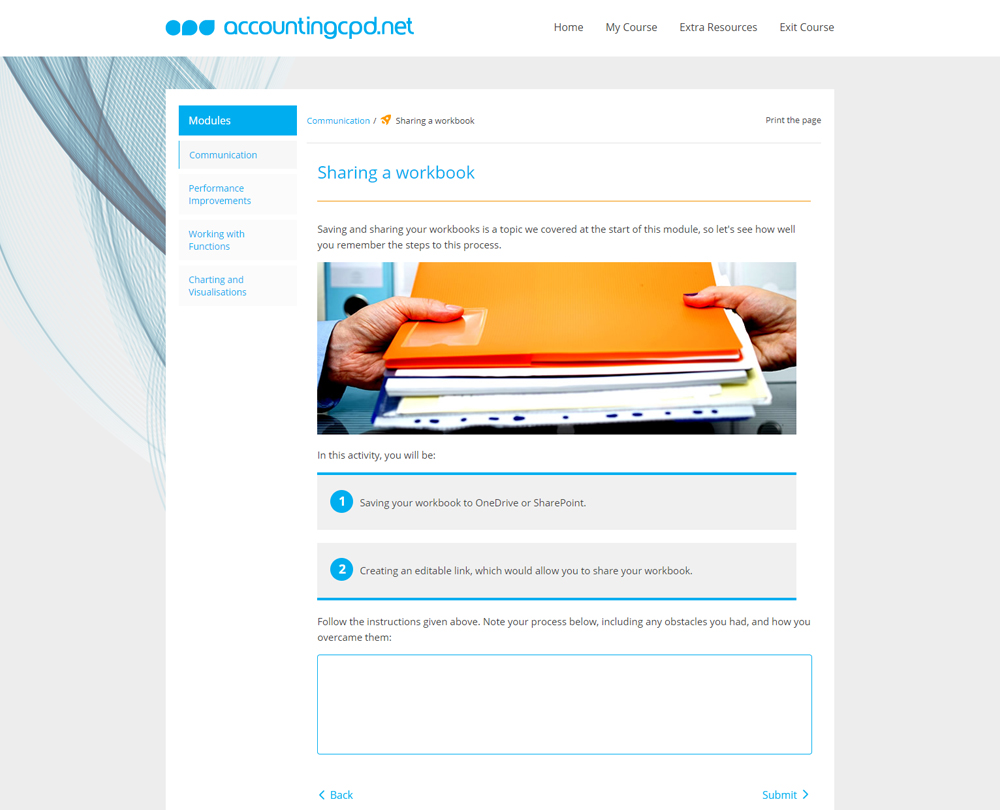
- What changes have been made to saving and restoring files?
- What improvements have been made to accessibility?
- What are Ideas?
- How do I deselect extraneous cells?
- What other performance improvements have been made?
- Working with Functions
- How do I use the new IFS function?
- How do I use the SWITCH function?
- How do I use the TEXTJOIN function?
- What is the XLOOKUP function?
- Charting and Visualisations
- What enhancements have been made to images and visuals?
- What is a funnel chart?
- What is a map chart?
- What are rich data types?
- How do I add a columns from an example?
How it works
Author

Reviews
You might also like
Take a look at some of our bestselling courses
This course is not currently available. To find out more, please get in touch.